Introduction
Overview of WSO2 Application Troubleshooting
Troubleshooting complex application frameworks like WSO2 is an essential skill for developers and system administrators. WSO2, a middleware architecture, integrates various components such as the WSO2 Identity Server (IS), Micro Gateway (MGW), and Micro Integrator (MI), which work together to manage digital identities, process API requests, and integrate systems effectively. When one of these components fails or performs suboptimally, it can degrade the entire system's functionality, making effective troubleshooting a critical competence.
Importance of Systematic Troubleshooting
Systematic troubleshooting within WSO2 applications helps isolate and identify problems quickly and efficiently, minimizing downtime and improving service reliability. The methodology provided here guides you through a step-by-step approach to diagnosing and resolving issues, starting with understanding the application flow and progressing through detailed log analysis and performance optimization.
By the end of this guide, you'll be equipped with the knowledge to troubleshoot issues in the Identity Server component of WSO2 applications, ensuring smooth and reliable operations within your IT infrastructure.
Understanding Your Application Flow
When troubleshooting WSO2 applications, it is crucial to have a clear understanding of the overall application flow. This not only helps in pinpointing where issues may be occurring but also aids in systematically addressing them without overlooking any components that might be impacting the application’s performance.
Typical WSO2 Application Architecture
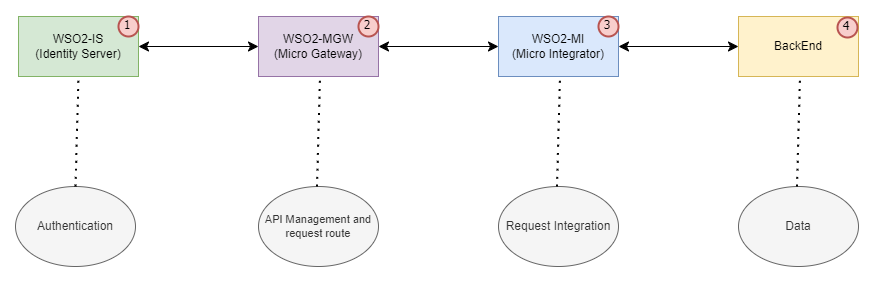
A typical WSO2 application flow might look something like this:
IS (Identity Server): Handles security and identity management, including authentication and authorization.
MGW (Micro Gateway): Acts as a lightweight, configurable gateway that secures, protects, and scales microservices.
MI (Micro Integrator): Allows integration of services and applications, facilitating communication and data exchange.
Backend Systems: These are the databases or other services that store and manage the application's data.
This flow is simplified; actual architectures can vary based on specific needs and implementations.
Diagram of WSO2 Application Flow:
Components Involved
Identity Server (IS): As the entry point for authentication, the Identity Server plays a pivotal role in managing user identities and ensuring that access to resources is securely controlled.
Micro Gateway (MGW): This component secures and routes API traffic, providing a crucial checkpoint for requests entering the system.
Micro Integrator (MI): Integrates various backend services by facilitating communication and data exchange between them.
Your Backends: These might include databases, file storage systems, or web services that ultimately process the requests and manage data.
Understanding each component’s role and how they interact is essential for effective troubleshooting. Knowing where each piece fits within the architecture makes it easier to trace the source of problems and address them efficiently.
Step-by-Step Troubleshooting Guide
Effective troubleshooting acts as a critical skill in managing and maintaining the integrity and performance of WSO2 applications. This section provides a detailed, step-by-step guide to help diagnose and resolve common issues that may arise within the WSO2 Identity Server (IS), one of the core components of WSO2's integration capabilities.
1. Identify the Relevant Cluster
The first step in the troubleshooting process involves identifying the cluster where the issue is likely originating. This could be any of the WSO2 components such as IS, MGW, or MI. Determining the right component to focus on can significantly reduce the time spent on diagnosing the problem.
Starting Points:
Review System Logs: Check the system logs for any error messages or unusual entries that correspond to the time the issue was reported.
Check Service Health: Utilize management consoles or direct API calls to ensure all services are running as expected.
User Reports: Consider user reports that may indicate at which point in the application flow the issue occurs most frequently.
2. Troubleshooting at the IS (Identity Server) Level
If the issue traces back to the Identity Server, the following detailed steps will guide you through diagnosing and potentially resolving the problem:
IS Access Log Analysis
The WSO2 Identity Server'shttp_access.log usually contains detailed records of HTTP requests. These logs are essential for tracking user interactions and identifying request patterns that could lead to issues.
AWK Command for Log Analysis:
awk '$NF > <time_threshold> && /<API_keyword>/ { print $0 }' http_access_.2024-04-20.log
<time_threshold>: Response time threshold (in seconds) considered problematic, e.g., 0.1 for 100ms.
<API_keyword>: Keyword to search for specific API calls, e.g., scim.
Example Command:
awk '$NF > 0.1 && /scim/ { print $0 }' http_access_.2024-04-20.log
Expected Output:
192.168.1.1 - - [20/Apr/2024:00:09:34 +0300] PATCH /scim2/Users/dc3a97b1-591e-400a-1334 HTTP/1.1 200 1327 - ballerina 0.106
192.168.1.1 - - [20/Apr/2024:01:04:40 +0300] GET /scim2/Users?filter=userName+Eq+AT4123aQW&domain=PRIMARY HTTP/1.1 200 1400 - Synapse-PT-HttpComponents-NIO 0.411
Entries with high response times or error statuses can indicate where bottlenecks or failures are occurring within the IS.
Network and Configuration Checks
Next Steps After IS Troubleshooting
After analyzing the IS logs:
Detailed Log Analysis: Look for specific error codes and response time patterns. Errors like 500 Internal Server Error or long garbage collection times can provide direct clues into the issues.
API Endpoint Performance: Evaluate if certain endpoints are consistently slow and examine the business logic or database queries they execute.
This step-by-step approach not only helps in narrowing down the issues but also facilitates a more structured and efficient troubleshooting process.
Detailed Log Analysis Techniques
Continuing from the initial troubleshooting steps, once the potential issues within the IS (Identity Server) are identified through basic log analysis, we delve deeper into more sophisticated log analysis techniques to further diagnose the problem.
Interpreting Common HTTP Error Codes
Understanding and interpreting HTTP error codes found in logs can provide significant insights into the types of issues the application is experiencing.
4XX Errors: Indicate client-side issues; for example, 404 Not Found suggests the requested resource is not available, and 403 Forbidden indicates access issues.
5XX Errors: Reflect server-side problems; 500 Internal Server Error is a general marker for server-side exceptions, and 503 Service Unavailable can suggest the server is overloaded or under maintenance.
These codes can help pinpoint whether issues are due to client mistakes or server failures and guide the next steps in troubleshooting.
Analyzing Response Times and Their Implications
Response times are critical in assessing the health and performance of the IS. Patterns in these times can indicate various issues:
Intermittent Spikes: Could suggest garbage collection issues or temporary network failures.
Consistently High Response Times: May indicate a need for scaling up resources or optimizing the application.
Logs that show response times exceeding certain thresholds should be closely examined to determine the cause of delays.
Identifying whether specific API endpoints are slower than others can uncover inefficiencies in business logic or database interactions:
Business Logic: Examine the processes executed by slow endpoints to identify costly operations.
Database Queries: Slow responses often trace back to database issues. Optimizing queries or enhancing database indexing can improve performance.
Example Log Entry for Endpoint Analysis
192.168.1.1 - - [20/Apr/2024:01:04:40 +0300] GET /scim2/Users?filter=userName+Eq+AT4123aQW&domain=PRIMARY HTTP/1.1 200 1400 - Synapse-PT-HttpComponents-NIO 0.411
This log entry indicates a GET request made to the SCIM2 endpoint which took longer than 0.4 seconds, suggesting a potential area for optimization either in the query or the service handling.
Following the detailed log analysis, the next step involves optimizing the application and database to alleviate identified issues.
Example Command to Identify Errors:
cat wso2carbon.log | grep -i "SlowQueryReport" | more
Example Output:
TID: [-1234] [oauth2] [2024-04-20 07:00:16,749] [551233ad-4147-e91ddsdwq12f]  WARN {org.apache.tomcat.jdbc.pool.interceptor.SlowQueryReport} - Slow Query Report SQL=SELECT * FROM (SELECT ACCESS_TOKEN, REFRESH_TOKEN, TIME_CREATED, REFRESH_TOKEN_TIME_CREATED FROM IDN_OAUTH2_ACCESS_TOKEN WHERE CONSUMER_KEY_ID=(SELECT ID FROM IDN_OAUTH_CONSUMER_APPS WHERE CONSUMER_KEY = ?)ORDER BY TIME_CREATED DESC) WHERE ROWNUM < 2;
time=1047 ms;
Database Tuning Techniques
Database performance is often a bottleneck in application environments. Key areas to focus on include:
A. Query Optimization:
Indexing: Create indexes on columns that are frequently used in WHERE clauses.
Rewriting Queries: Simplify and optimize SQL queries by minimizing nested queries and using joins over subqueries, which can significantly reduce execution times.
B. Database Configuration:
Adjust Pool Settings: Optimize the size of the connection pool to avoid delays if current limits are too low.
Server Resources: Ensure the database server is equipped with sufficient CPU and RAM to efficiently handle the workload, especially during high-demand periods.
C. Monitor and Adjust:
Regular Monitoring: Use log files or real-time monitoring tools to keep track of slow queries, allowing for timely interventions.
Performance Testing: Routinely test database performance to identify and rectify bottlenecks before they affect the production environment.
Also WSO2 may have many other bugs on IS side. A few of the above mentioned.
Code Profiling and Its Benefits
Code profiling is an essential method for improving the performance of an application. Profilers like YourKit or JProfiler can help identify which parts of the code are slow and consume excessive resources:
Method Execution Times: Pinpoint methods that take the longest to execute and require optimization.
Resource Usage: Assess how much CPU and memory are used by different parts of the application and optimize usage.
Further diagnostic tools can provide deeper insights:
APM Tools: Application Performance Management tools like Dynatrace, New Relic, or AppDynamics offer real-time performance monitoring and can pinpoint issues down to specific lines of code.
Log Aggregators: Tools like ELK Stack or Splunk can centralize logs making it easier to analyze data and spot trends or anomalies.
These tools are invaluable for maintaining optimal performance and quickly resolving new issues as they arise.
After optimizing application and database performance based on detailed log analysis, employing advanced monitoring tools can further enhance your ability to detect and resolve issues swiftly. These tools are designed to provide real-time insights and a comprehensive overview of your application’s health.
Application Performance Management (APM) tools are essential for continuous monitoring and management of application performance and availability. They help in identifying, diagnosing, and resolving application performance issues before they affect the business processes.
Real-Time Monitoring: Track live performance data and receive instant alerts on issues.
Detailed Insights: Gain deep insights into application operations, from web transactions to database queries.
Root Cause Analysis: Quickly pinpoint the underlying causes of performance bottlenecks.
Dynatrace: Provides full-stack monitoring from the application layer down to the infrastructure level.
New Relic: Offers detailed performance metrics and a flexible, intuitive dashboard for managing web applications.
AppDynamics: Focuses on application networking and machine learning to predict and resolve performance issues.
Log Aggregators and Their Advantages
Log management tools aggregate logs from all components of the application stack, making it easier to perform comprehensive analyses. They help in visualizing data that is critical for understanding the application’s performance over time.
Functions of Log Aggregators:
Centralized Logging: Collect logs from various sources into a single platform to simplify access and analysis.
Improved Search Capability: Facilitate advanced search capabilities to swiftly find relevant log entries.
Visualization Tools: Provide graphical tools to help visualize complex data sets, highlighting trends and anomalies.
Examples of Log Aggregators:
ELK Stack (Elasticsearch, Logstash, Kibana): Integrates three tools for processing and visualizing logs. Elasticsearch indexes the data, Logstash processes it, and Kibana provides the visualization interface.
Splunk: Known for its powerful search and analysis capabilities, ideal for troubleshooting and securing complex applications.
Using these advanced tools, organizations can maintain a proactive stance towards application performance management, ensuring high availability and optimal functioning.
Maintaining a Holistic View of Application Health
Cascading Effects: Be aware that issues in one component can affect others; a holistic view helps in identifying such cascading issues early.
Regular Checks: Implement regular performance checks and optimize configurations as needed to adapt to new demands or changes in the operational environment.
Error identify code (WSO2 IS) | Description |
cat wso2carbon.log | grep -i "SlowQueryReport" | more
| Using this we can identify the slow database query |
awk '$NF > 0.1 && /scim/ { print $0 }' httpaccess.2024-04-20.log
| Identify the scim request responses time |
awk '$NF > 0.1 && /token/ { print $0 }' httpaccess.2024-04-20.log
| Identify the token request responses time |
Conclusion
Troubleshooting a WSO2 application involves a comprehensive approach that extends from basic log analysis to advanced performance monitoring. By methodically applying these techniques across the Identity Server, Micro Gateway, and Micro Integrator components, you can ensure robust performance and high availability of your applications. Regular use of APM tools and log aggregators plays a crucial role in maintaining ongoing application health and swiftly addressing new issues as they arise.
Employing these systematic troubleshooting and optimization steps will not only help resolve existing issues but also enhance the overall efficiency and stability of your WSO2 deployment.